Something that can be of value to any prepper at any stage of development, even urban preppers in tight dwellings, is planning. Permaculture’s sectors and zone maps are two of the most powerful tools for developing a plan, both for assessing risks, identifying resources, and developing efficient plans for a site.
Usually sectors gets covered first. I’m going to cover Zones instead. I highly endorse doing a search for “permaculture sectors” – that’s where risks and resources are going to be found. Research it with an eye for defensive and evacuation potential as well.
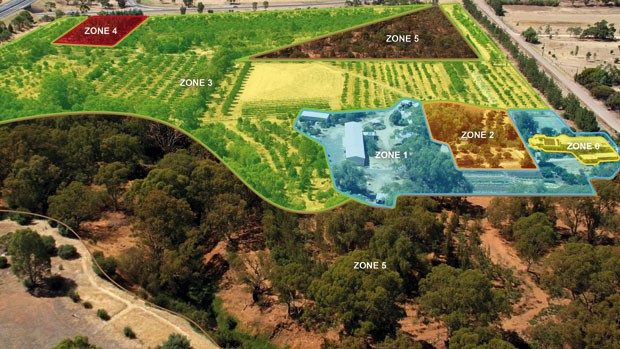
Zone mapping in permaculture is where we define areas by our presence, using activity and energy input level. By consolidating things that need the same amount of interaction, or even each other, we can greatly increase our efficiency. With a map that actually shows our patterns, and our goals, we can move or site things to maximize that efficiency.
Permie Zones
Permaculture zones are abstract geographic areas delineated from the other areas of our property – or our habitual paths – by the amount of time we spend in that area. The zones are based on access, not geographic nearness to our homes and beds. Many zone map examples are shown in concentric rings, but actual zones are drawn and defined by our energy and presence, not distance.
Permaculture universally recognizes 5 zones, in ascending order based on the time we spend there. Sometimes there’s a Zone 0 for the self or the home. The primary-activity and most-visited zones are Zones 1 and 2.
1 – Very intensive presence – Most active, usually multiple trips/passes daily
2 – Intensive use – Active, possibly still multiple visits per day, but not quite as frequent as Zone 1
Zone 1 is where your paths most frequently take you. It’s based almost entirely on our human environment.
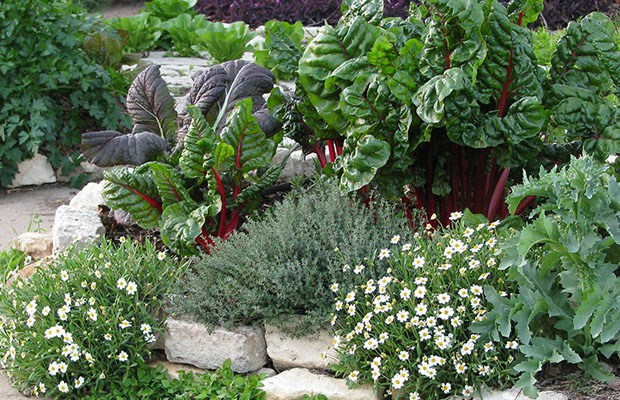
Things like kitchen herbs and table gardens that need irrigation or are harvested from daily, pets and livestock that are visited daily for care or entertainment, and daily waste and composting areas are located in Zone 1.
Our kitchens and bathrooms are pretty automatic on a household/apartment level, although in permaculture, most will automatically stick the whole house in Zone 0-1.
I don’t, because I have a front stoop I almost never go in/on/through, a spare bedroom I’m only in one part of the year, only pass through my den, and on a daily basis, I usually only poke my head into the living room if I’m looking for a person or a dog. On the other hand, my father spends far more time in the living room. He rarely uses his kitchen porch, whereas my mother and I are on ours ten to fifteen times a day for access to the yard, gardens, or letting animals in and out.
The inclinations between the back and kitchen doors and-or time spent in different rooms change the views and the opportunities our presence offers. For us, it matters. For others, maybe not as much.
Zone 1 sometimes includes livestock, or sometimes they’re bumped to Zone 2, even if they’re livestock we bed down and release, milk, collect eggs from, or feed twice daily.
Zone 2 includes those areas that may not see quite as much human interaction. Regularly permies will include things like perennials with longer seasons between harvests and less daily and weekly care needed, and some livestock like foraging cattle or meat goats.
Zones 3 and 4 see increasingly less human interaction and fewer human inputs (or will, once established).
Zone 3 is larger elements, usually – the bulk foods like grains and orchards, animal pastures, ponds. They are things we may only see weekly, monthly or quarterly.
Zone 4 gets even less interaction. Usually this is managed land, tailored for foraging, livestock fodder and crop trees, timber, and longer-term grazing.
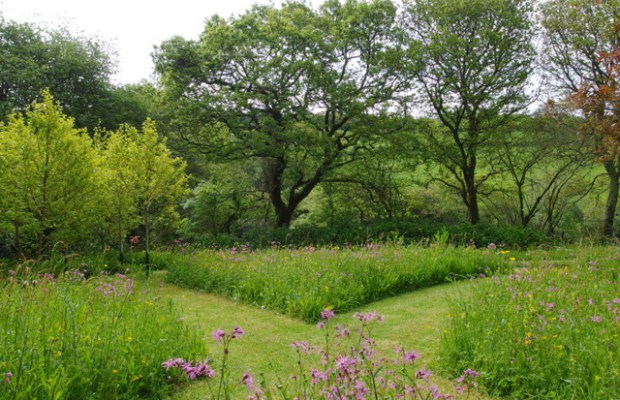
Zone 5 is an area that humans largely leave alone. Some will define this as an entirely wild area. Some will define it as a managed wild area.
To some, it’s for nature and only nature – left as a green-way – while to others, periodic hunting or foraging in this area is expected. For others, Zone 5 might be brush piles, frog houses, owl and dove and bat houses, little native patches of weeds, and other things we scatter through a yard and garden and affix to buildings to encourage helpful wildlife.
This site deepgreenpermaculture.com has a more detailed set of examples and some graphics of Zone definitions. It also has some subsections about common zone sizes.
Permaculture Research Institute – Urban farm rabbits located over composting bins, near water catchment, and along path between house, shed and garage.
Urban & Suburban Sites
There’s nothing wrong with taking a set of known factors and twitching it. Zone definitions can be rearranged and relisted, tailoring them to fit our lifestyles.
For an apartment, condo, or a single-family home on less than a half-acre, zones shrink and include our floorplan. When we turn to sector mapping, we zoom out and include more of our neighborhood with condos and small yards, but that “zoom” can apply to zones as well.
Regardless of where we’re going, or what’s around us as we putter through the day, our habits tend to change by season, and what’s around us changes. There may be areas we can “expand” into besides our own property.
That’s really worthy of its own article, but some examples would be any areas we can hit with seed bombs for wild edibles or for plants that can be improving the soil now for use in a crisis. We might have parks, verges, ditches and other areas that are untapped resources but are on some of our daily, weekly and monthly beaten paths. We might also find landowners (or absent landowners) to talk to about growing space, or have rooftops or fire escape landings that we can use for planters and water catchment, now or “after”.
Knowing where we go most frequently will help even the tiniest studio prepper identify places that have the most potential with the least effort – and that’s really what efficiency is all about, with efficiency one of the major gods of the permies.
Multiple Maps
What I recommend and what I do for clients is to actually print three identical maps. Two are for “right now”, and are going to be our habitual activity maps, one for the “high season” when we’re outside the most and one for the “slow season” when we’re outside least.
The third map is going to be our “ideal” map – what we’re about to work to make happen.
See, we’re going to use these maps to identify existing zones using our current activity. However, going back to efficiency, we’re also going to use them as a planning tool. Some of the trends we identify will lead to changes, hopefully consolidating our zones of activity for better efficiency.
We can also nab a wider view for our neighborhoods, even as home- and landowners.
Those with significant acreage might want to do one map set with just the house and the 0.5-1 acre it sits on and a second set with the whole property and a margin around it.

Supplies for Mapping
Printing and drawing really is the easiest way to make this happen. You can use computer programs to trace lines that will progressively darken or lighten with every pass. That’s not crazy talk, since it offers opportunities to make multiple-scale maps at once, then just zoom in and out. For the average client, it’s a black-and-white drawing or Google map of their property, regularly with a chunk of the surrounding area that’s going to leave some margin for additional notes.
I really like the Google Earth maps that are nice and up-to-date, and that you can adjust by season and time of day. They let you pick noon in the barest of winter, which lets you “see” more of your property. If you can’t get a free submission to Google Earth, find out if a local library has it, do some screen grabs at various zooms/scales and print them off wherever it’s cheapest.
For paper, standard letter 8.5×11” is fine, or we can go up to 11×17 or even 17×24” if we want.
We’ll also want some coloring supplies.
A couple of sharpened crayons or colored pencils are fine. Markers also work, although you either want really fine points or really big maps. Aim for colors that are easy to see on a simple map, that you’ll be able to see the map through (no dark Sharpies or pens), and that will darken as you overlap lines. Red, orange, blue, and pale purple tend to work really well.

One Map
If you only want to print one map, no big there. Hit the dollar store for some of that thin notebook or copy paper that you can trace through. You can shine a light through some plastic or use a bright window to help see better. Call it an overlay.
You can also create a larger map and make overlays of your zones and sectors using contact paper and map pens or grease pencils.
Overlays will also help reduce printing in case you decide you want to add seasonal maps, do maps for each member of the family, or combine everything into a single map.
It’s also a backup against an ill-timed sneeze, doggy nose-bump, or a beloved’s alarm going off and making us jump with a marker in our hand. Hey, we’re preppers. Prepare for crazy things.
The Process of Activity Mapping
This is where the “darkens as we overlap lines, but not too dark” comes into play. Observe, then color.
Start with your first work-day wake-up, and trace your tracks through the house, then outside it. Back and forth, bathroom, coffee, paper, animals, meals, vehicles, back and forth, all through your day until you tuck yourself in at night. To and from the bus, trash can, walking the dogs, as we hang out and retrace steps from vehicles or gardens to sheds and garages, the hose, indoor faucets, all the way down our rows and around our flower/garden beds.
Don’t draw bird-flies straight lines. Trace the actual path everyone takes. Then repeat for the work week, and the weekend.
Remember, it’s the overlaps – resulting in darker colors – that give us our current intensity of use. Be honest with yourself. You’re the one who does or doesn’t benefit.

Zone Map
Your existing zone map just drew itself.
The darkest areas are your 0-1-2 zones. Your palest and untouched areas are your Zone 4 and really, really excellent places to expand that Zone 4 or develop your Zone 5.
Now we go through, and kind of divide those spaces into blobs and blurbs and modern art. We can re-draw or trace our map and give them different colors now, or make them more uniform shades, or just more clearly delineate edges.
You should be able to identify some of the areas you only hit a couple of times a year, like pruning, or places we inspect and repair only as needed.
We should also be observant enough to know those wide, looping, lightly-drawn areas are only us mowing – and maybe we keep those in our map in their apparent zones, or maybe we go back and remove those, or lighten them to more accurately reflect how much attention they actually get while they’re getting mowed. Otherwise, especially for us Southerners, our summer map is going to show our twice-weekly or 2-6 times-monthly sing-along ride or teenager’s slave labor as getting more attention than our workshop and laundry room.
Shoveling snow and raking leaves has some impact on applying the information we just gathered, but not really a ton, so you can go light there, too, if you like.

Applying the Zone Map
Our map doesn’t just sit there. It’s a tool, one of many.
Most of us are likely to have some of our darker/intense areas out there on their own, and many of us likely have dark lines like a drunken spider’s web hooking and criss-crossing.
Those oddball dark jags are places where we can consolidate some of our activities, instead of leaving them suspended and isolated. That will save us time and effort, which will make us more efficient.
When we plan to expand gardens or even change where we keep the tools we use, consult the existing zone map. Places we’re already passing make excellent locations for those.
If we’re passing them regularly, they get more attention and we see that they’re dry, being eaten by critters, sick and sad, or ready to harvest. Being faster to respond to them, and able to respond immediately with tools if necessary, will result in better yields.
 Worm bin composter located near the source of feed and easy access to water.
Sometimes we might look at our plan and actively renovate things we already have in place – especially if those things don’t get the attention they should. The extra attention and ease may make it worth it to switch from conventional beds to a series of trash cans turned into vertical gardens, from hot composting piles kept across the yard to a pipe composter in a keyhole bed or a worm composter near the kitchen or the trash.
We may move livestock so it’s faster and easier to get them into gardens for pest control or tilling, or to get composted manure onto large plots. We might move them somewhere else so they’re easier to toss kitchen scraps to.


We might eschew the usual advice of sticking an orchard out-out so we can put small livestock under it, or to make some additional use of our dog runs and kids’ play areas.
Things like the sectors that affect our property, stacking elements and stacking functions, mapping water movement, and switching to low- or lower-labor growing styles that fit into our busy lives can all help make our properties, big or small, more efficient and productive.
A zone map will help us further analyze where we can increase our efficiency and help us visualize how the puzzle pieces of our production and resources can best fit together. We can then play with the map, marking future expansions to see how they’ll fit in with our current traffic flows and patterns, and make our properties more versatile, resilient and productive all over again.


